Debits vs. Credits: Don’t Let This Accounting Error DRAIN Your Profits!
March 29, 2024
Small Businesses: You’re Probably MISSING OUT on These HUGE Tax Write-Offs!
April 11, 2024How To Read & Analyze The Balance Sheet: A Beginner’s Guide
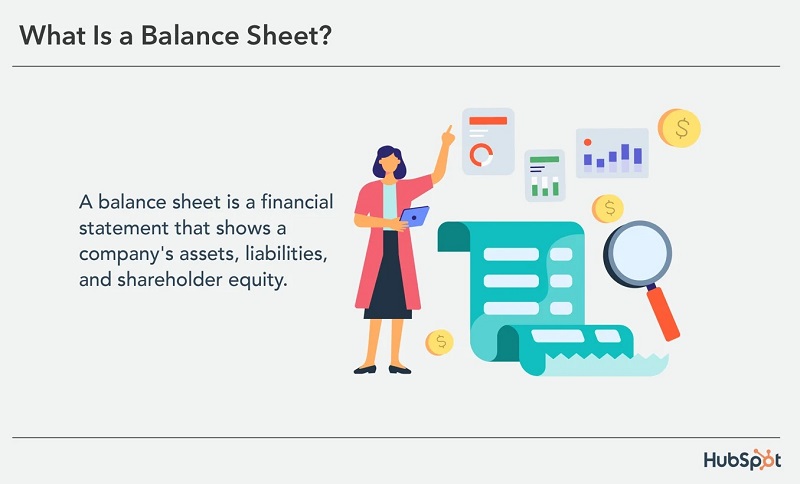
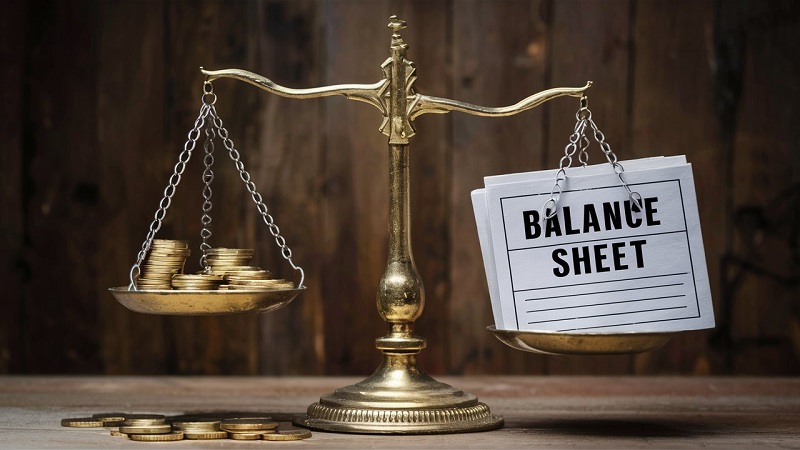
The balance sheet is a fundamental financial statement that provides a snapshot of a company’s financial health at a specific point in time. It acts like a giant scale, balancing a company’s assets (everything it owns) with its liabilities (what it owes) and shareholders’ equity (the net worth of the company). By understanding how to read and analyze the balance sheet, you can gain valuable insights into a company’s financial stability, liquidity, profitability, and overall efficiency. This knowledge is crucial for investors, creditors, and business analysts alike.
-
Importance of balance sheet analysis:
- Assess a company’s financial health and risk profile.
- Evaluate its ability to meet short- and long-term obligations.
- Compare financial performance with industry benchmarks.
- Make informed investment decisions.
-
Who uses the balance sheet?
- Investors: To assess potential investment opportunities.
- Creditors: To determine a company’s creditworthiness.
- Business analysts: To evaluate a company’s financial performance.
- Managers: To monitor financial health and make strategic decisions.
The Balance Sheet Equation: Foundation of Analysis
At the heart of every balance sheet lies a fundamental equation:
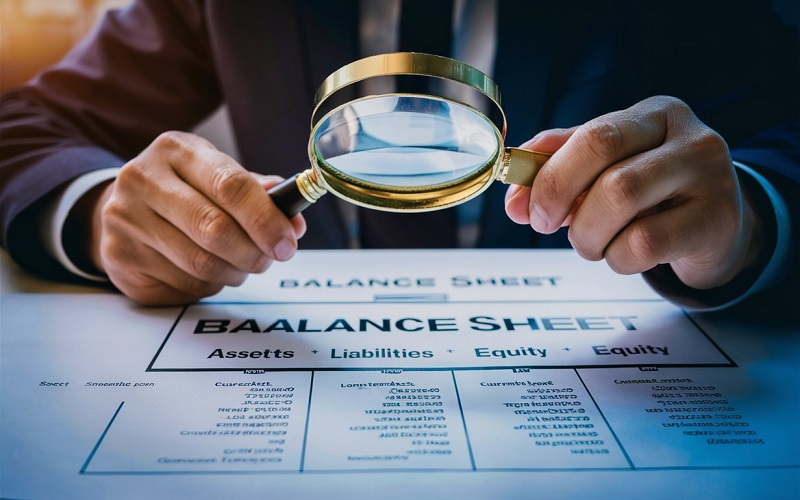
Assets = Liabilities + Shareholders’ Equity
This equation represents the core concept of balance. It states that the total value of a company’s assets must always equal the sum of its liabilities (what it owes to creditors) and shareholders’ equity (the investment of owners and retained earnings).
Understanding this equation is critical for interpreting the balance sheet effectively. It ensures that a company’s resources (assets) are financed by a combination of debt (liabilities) and the owner’s investment (equity).
Diving Deeper: Key Components of the Balance Sheet
The balance sheet is typically divided into three main sections:
-
Assets: Everything a Company Owns
- Assets represent the economic resources a company owns or controls that are expected to generate future benefits. They are generally categorized into:
- Current assets: These are highly liquid assets that can be easily converted into cash within one year. Examples include cash, accounts receivable (money owed by customers), and inventory.
- Non-current assets: These are long-term investments that are not intended for immediate conversion into cash. Examples include property, plant, and equipment (PPE), land, and intangible assets (like patents or trademarks).
- Assets represent the economic resources a company owns or controls that are expected to generate future benefits. They are generally categorized into:
-
Liabilities: What a Company Owes (100 words)
- Liabilities represent the company’s financial obligations to outsiders. They are typically classified as:
- Current liabilities: These are short-term debts that must be repaid within one year. Examples include accounts payable (money owed to suppliers), accrued expenses (expenses incurred but not yet paid), and short-term loans.
- Non-current liabilities: These are long-term debts that are not due within one year. Examples include long-term loans, mortgages, and bonds.
- Liabilities represent the company’s financial obligations to outsiders. They are typically classified as:
-
Shareholders’ Equity: The Company’s Net Worth (50 words)
- Shareholders’ equity represents the ownership stake of shareholders in the company. It’s calculated as the difference between assets and liabilities. In simpler terms, it’s the company’s net worth.
By analyzing the composition and value of each section, we can gain valuable insights into the company’s financial health and risk profile.
Finding a Balance Sheet: Where to Look?
Locating a company’s balance sheet is a breeze! You can typically find it in the following places:
- Annual reports: These comprehensive reports contain detailed financial statements, including the balance sheet.
- Company websites: Many companies make their financial statements readily available on their investor relations section.
- Financial databases: Online financial databases also provide access to historical and current balance sheets for publicly traded companies.

Analyzing the Balance Sheet Like a Pro
Now that we’ve grasped the fundamental structure of the balance sheet, let’s delve deeper and explore how to analyze it for valuable insights.
Liquidity Analysis: Can the Company Pay its Short-Term Debts?
Liquidity analysis assesses a company’s ability to meet its short-term financial obligations. Here, we focus on current assets and current liabilities. Common liquidity ratios include:
- Current ratio: This ratio measures a company’s ability to cover its current liabilities with its current assets. A ratio greater than 1 indicates sufficient liquidity, while a ratio below 1 suggests potential difficulty meeting short-term obligations.
Current ratio formula: Current Assets / Current Liabilities
- Quick ratio: This is a more stringent test of liquidity, excluding inventory (as it may take time to sell) from current assets. A higher quick ratio indicates a stronger ability to meet short-term debts.
Quick ratio formula: (Current Assets – Inventory) / Current Liabilities
- Cash ratio: This is the most conservative measure of liquidity, focusing only on the most liquid assets (cash and equivalents) to cover current liabilities. A higher cash ratio suggests a stronger ability to handle immediate financial needs.
Cash ratio formula: Cash and equivalents / Current Liabilities
By analyzing these ratios, you can assess a company’s risk of defaulting on its short-term debts and its overall financial flexibility.
Solvency Analysis: Is the Company Financially Stable?
Solvency analysis evaluates a company’s long-term financial health and its ability to meet its long-term obligations. Here, we focus on a company’s capital structure, analyzing the mix of debt and equity financing. Common solvency ratios include:
- Debt-to-equity ratio: This ratio measures the proportion of debt financing compared to equity financing. A higher ratio indicates a greater reliance on debt, which can increase financial risk.
Debt-to-equity ratio formula: Total Liabilities / Shareholders’ Equity
- Debt ratio: This ratio specifically focuses on the portion of a company’s assets financed by debt. A higher debt ratio suggests a higher risk of financial distress if the company struggles to generate sufficient profits.
Debt ratio formula: Total Debt / Total Assets
By analyzing these ratios, you can gauge a company’s ability to handle its debt burden and its overall financial stability in the long run.
Efficiency Analysis: How Effectively Does the Company Use its Assets?
Efficiency analysis assesses how effectively a company manages its assets and generates revenue from them. Here, we analyze how quickly a company can convert its assets into cash. Common efficiency ratios include:
- Inventory turnover ratio: This ratio measures how many times a company sells and replaces its inventory throughout a period. A higher ratio indicates efficient inventory management, while a lower ratio might suggest overstocking or slow-moving inventory.
Inventory turnover ratio formula: Cost of Goods Sold / Average Inventory
- Accounts receivable turnover ratio: This ratio measures how effectively a company collects payments from customers on credit. A higher ratio indicates faster collection of receivables, while a lower ratio might suggest potential issues with credit management.
Accounts receivable turnover ratio: Net Credit Sales / Average Accounts Receivable
By analyzing these ratios, you can assess a company’s operational efficiency and its ability to manage its working capital effectively.

Profitability Analysis: How Profitable is the Company?
Profitability analysis evaluates a company’s ability to generate profits from its operations. Here, we analyze how effectively a company uses its assets and equity to generate income. Common profitability ratios include:
- Return on equity (ROE): This ratio measures the return on investment for shareholders. A higher ROE indicates a company is generating a good return on the shareholder’s equity.
Return on equity formula: Net Income / Shareholders’ Equity (average)
- Return on assets (ROA): This ratio measures the profitability of a company’s assets, regardless of how those assets are financed. A higher ROA indicates a company is effectively generating profits from its assets.
Return on assets formula: Net Income / Total Assets (average)
By analyzing these ratios, you can assess a company’s overall profitability and its ability to generate sustainable earnings growth.
Limitations of Balance Sheet Analysis (100 words)
It’s important to acknowledge the limitations of balance sheet analysis:
- Relies on historical data: The balance sheet provides a snapshot at a specific point in time. It doesn’t necessarily predict future performance.
- Accounting policies can impact interpretation: Differences in accounting methods can affect the reported values on the balance sheet, making comparisons between companies challenging.
Therefore, it’s crucial to combine balance sheet analysis with other financial statements (income statement and cash flow statement) for a more comprehensive understanding of a company’s financial health.
Beyond Ratios: Additional Techniques for Balance Sheet Analysis
While ratios are powerful tools, there are additional techniques to glean further insights from the balance sheet:
- Horizontal analysis: This involves comparing a company’s balance sheet items across different periods (e.g., year-over-year) to identify trends in asset growth, debt accumulation, or changes in equity.
- Vertical analysis: This involves expressing each balance sheet item as a percentage of total assets to analyze the composition of the balance sheet and identify any significant changes over time.
By combining these techniques with ratio analysis, you can paint a more complete picture of a company’s financial performance and risk profile.
FAQs
- What if the balance sheet doesn’t balance? (50 words)
A non-balancing balance sheet typically indicates errors in data entry or accounting calculations. It’s crucial to ensure both sides of the equation (Assets = Liabilities + Shareholders’ Equity) balance for an accurate financial picture.
- Where can I learn more about balance sheet analysis? (50 words)
Numerous online resources, financial websites, and investment courses offer in-depth tutorials and guidance on balance sheet analysis. Consider reputable sources like The Balance: A Beginner’s Guide to Understanding the Balance Sheet: https://www.investopedia.com/terms/b/balancesheet.asp or the Corporate Finance Institute: In-Depth Guide to the Balance Sheet: https://cfifinancial.com/en/learn-to-trade/what-is-the-balance-sheet-and-how-to-analyze-it.
- How often should I analyze a company’s balance sheet? (50 words)
The frequency depends on your investment goals and risk tolerance. For long-term investments, annual analysis might suffice. For short-term trading or volatile markets, quarterly or even more frequent analysis may be necessary.
Resources
- The Balance: A Beginner’s Guide to Understanding the Balance Sheet
- Corporate Finance Institute: In-Depth Guide to the Balance Sheet
- Investopedia: How Do You Read a Balance Sheet?


